2024 Election Model - The Hudson Line
The View from the Afternoon
I know what you’re here for, but if you have the patience to humor me, I do feel it is important to note one thing. Seems a bit late for this, right? There is a reason I did not release a rolling election model months ago to this effect.
I will not go much into the technical details today as I feel it makes more sense in a post-election debrief of “how predictive was this model?”, but when one releases something claiming to predict who the president is months in advance, others tend to put a lot of faith in that. If I was updating it every day as was initially my plan, many people would check it anxiously, as I have since July. In addition, our flawed brains aren’t the best at determining objectively if something like this has “worked.” If I predict one candidate has a 51% chance of winning and the other narrowly wins, that is presumed to be a failure. In contrast, if I predict an extremely narrow race and the candidate I said had 51% odds wins in a landslide, somehow I have succeeded at my job.
I feel most everything I do needs to be put out with a decent amount of context, for instance that this is the first presidential election I have been old enough to participate in (I voted here in Manhattan on the first day, Saturday before last). I don’t have a college degree nor am I presently in school, and in the credits I did attain you won’t find a statistics class, a data science class, or really anything even slightly related where I got a grade above a C.
I don’t say this to self deprecate, but my point is that I am not a savant and this is not magic. Modeling a presidential election is modeling 56 separate but interrelated elections nationwide (the 50 states plus DC, plus the five congressional districts in Nebraska and Maine which assign electors independent of statewide totals) and then stitching them all together. I have created my own proprietary weight of different polling and economic factors and data back to the 1948 election to do that using a lot of complicated sounding techniques: “elastic net regression,” “Monte Carlo simulation,” “polling firm weighing and house effects” and while I am proud of it, I will be far off the mark way more often than I will be on the money.
Every day going back to February 29th, I have simulated 10,000 elections. In these 250 days, that amounts to 2.5 million elections within reasonable error margins from the exact median result implied by my personal factor weights spat into a file on my computer. Chances are one of those results is incredible close to the actual outcome, but given this is not magic, all I can give you for now is the median scenario and the odds each candidate had from these simulations.
But enough of the wait:
Toplines
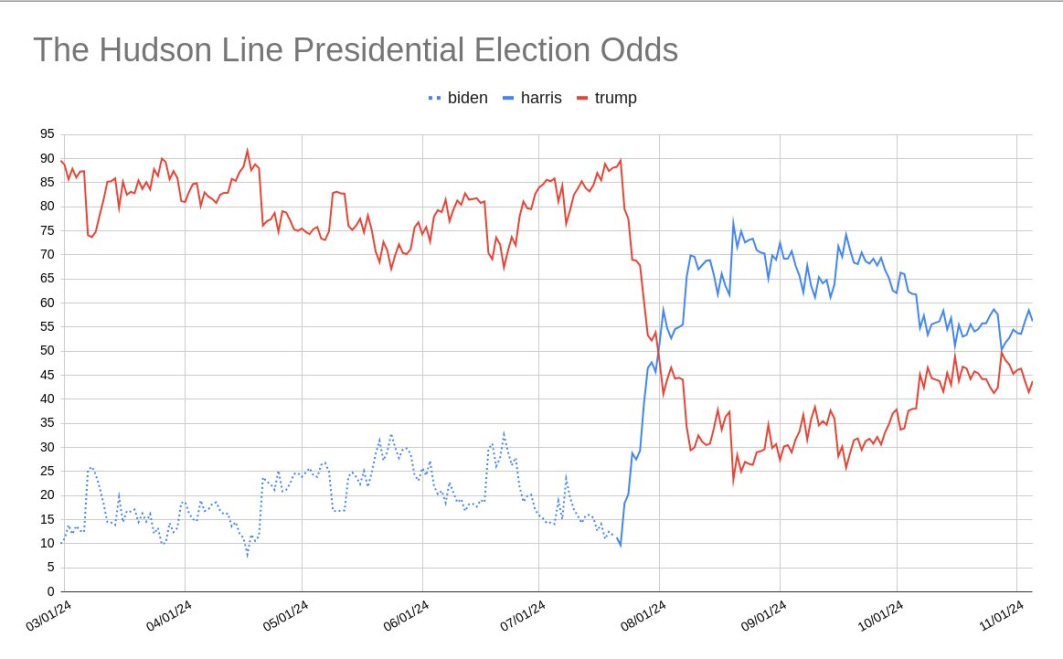
My model predicts that Kamala Harris has 56.2% odds of winning the presidency, with 43.8% odds for Donald Trump. In the median scenario, the popular vote is 49.9% for Harris to 46.9% for Trump and he flips the states of Arizona and Georgia from Biden, giving an electoral count of 276-262. Only 9 states have below a 90% chance of going for a candidate, and they are labeled in the image.
When I began this model, Trump was dramatically favored for the presidency, oscillating between 70% and 90% for most of his time running against President Biden. His departure from the race precipitated one of the most dramatic comebacks in polling I have ever see, with Harris becoming favored within a matter of days and even reaching the 70% range herself at one point. As the race has gotten closer and undecideds have become easier to read the race has narrowed significantly, but regardless Kamala Harris on this final day remains a moderate favorite for the Presidency, though as I prefaced beforehand that does not mean she is running away with it.
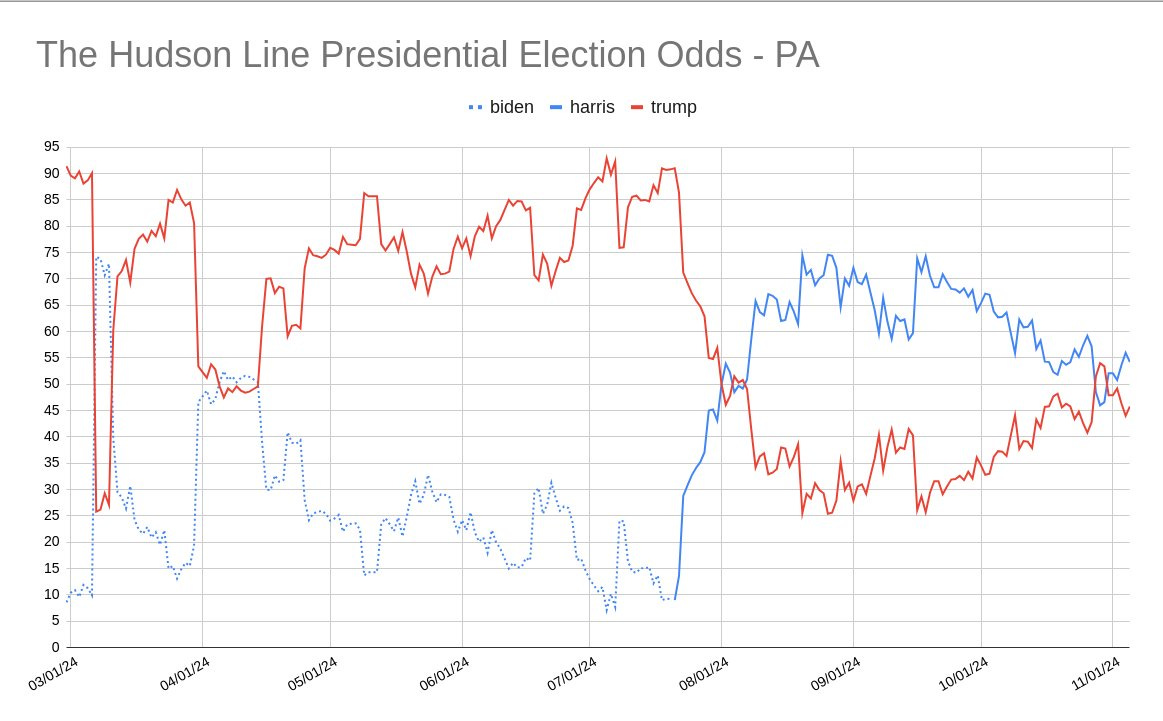
Pennsylvania - 54.2% Harris
A single state, Pennsylvania by an average margin of 0.586% or about 41,000 voters is the tipping point in the vast majority of simulations. It is no wonder then that the chart of the national odds of winning the election track so closely with the odds of winning Pennsylvania as to particularly in recent weeks look nearly identical.
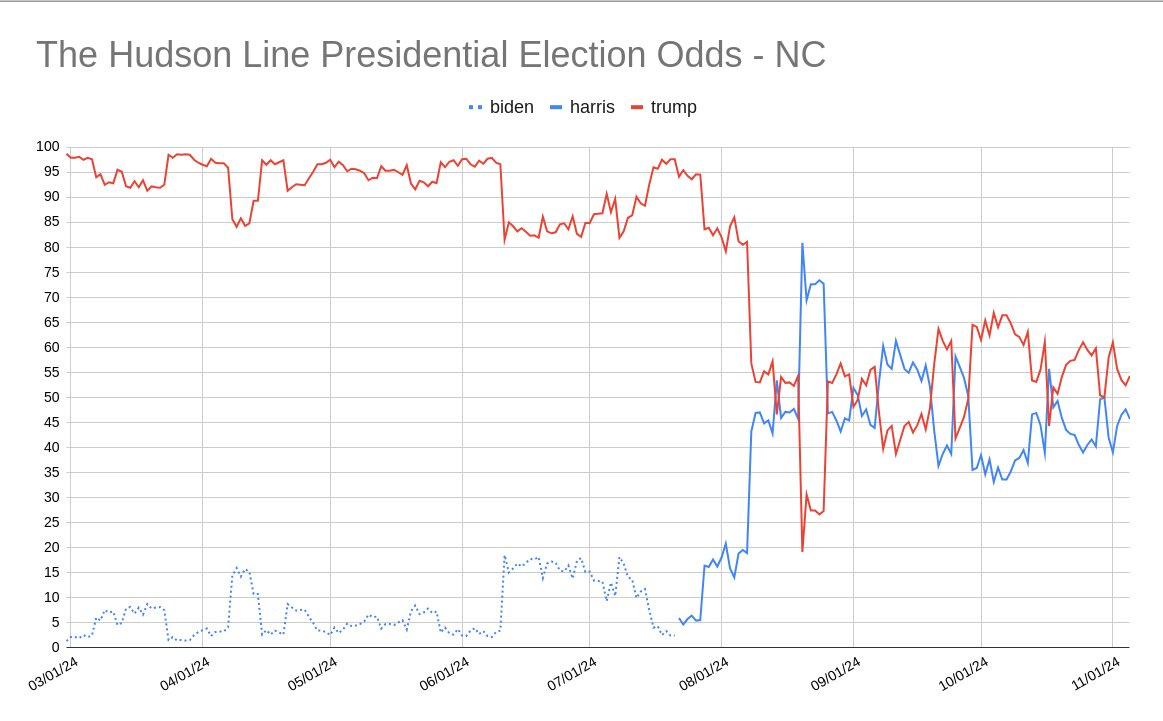
North Carolina - 54.3% Trump
The second-closest state in my model is North Carolina, which initially looked like a rather hopeless prospect for a Democratic pickup but has come well into play due to a Republican gubernatorial candidate in polling freefall in Mark Robinson and continued demographic shifts especially due to snowbirds from more liberal states (my grandparents, mother, and sister all live in North Carolina today).
Georgia - 55.9% Trump
In Georgia we have our first flip of the night, while demographic and political trends are quite favorable to Democrats this cycle Harris has consistently lagged in polling, though not nearly as much as her predecessor. It remains within striking distance, but Trump is a slight favorite. Particularly in recent weeks, Harris has been surging here at Trump’s expense.
Nevada - 57.5% Harris
I don’t herd my model at all because I believe it biases it unduly but sometimes this has strange implications. I am skeptical Harris is doing this well in Nevada. Republicans have a large early vote lead and while Democrats are projecting confidence it can be overcome with Clark County election day vote and even Jon Ralston has taken that position, in terms of the raw number of votes I expect this to be the closest state in the country and I believe the model may overestimate Harris while she may still be a slight favorite. But the math is the math and I have made a point of not intervening when I don’t agree with what my algorithm is saying.
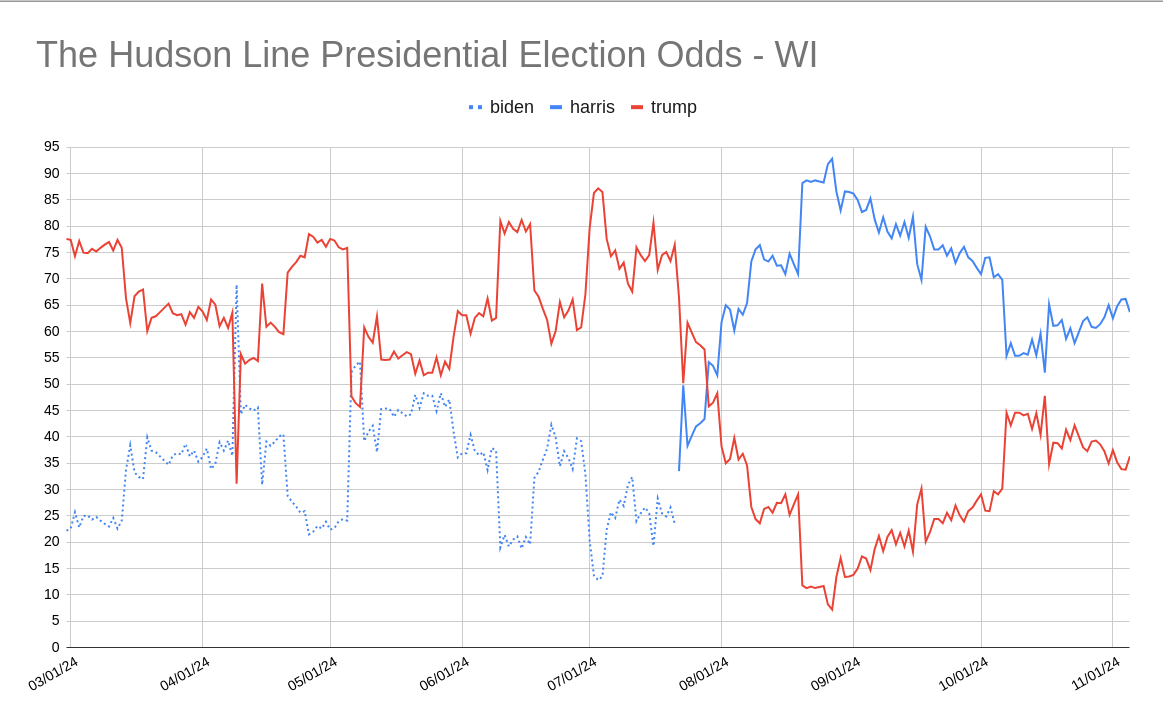
Wisconsin - 63.7% Harris
Earlier in her campaign, Harris managed to even get past 90% odds of winning Wisconsin and while the numbers have come down to earth since then, she remains decently favored to take the state and has had a positive trajectory in her numbers even in the closing weeks.
Michigan - 64.6% Harris
Once far more precarious due to a large Trump polling lead and the Gaza protest vote, Michigan has stabilized into perhaps the most consistent swing state in the Harris column. Trump however has been closing the gap in the final weeks.
Arizona - 66.5% Trump
I pride myself on not herding, but in this state I am certainly not sticking out from the pack. While opening a nice lead in the first few weeks of her campaign, Harris has again lagged behind Trump in Arizona. All this oddly while the Democratic Senate nominee, Ruben Gallego, has consistently been shown leading over well-known former gubernatorial candidate Kari Lake, who rather unexpectedly lost in the Biden midterm to a Democrat. This is again another place where I am softly skeptical of my own model that there is this dramatic a favorite.
Iowa - 82.0% Trump
This is certainly one of the weirder charts in my model. When Biden was running, I attributed his closeness in the vote to one or two low quality polls which as in 2020 greatly overestimated his support. I figured this normalized once Harris was in the race, though her peak in late August still seemed a bit unlikely. Then a week ago arguably the most well-respected pollster in the country J. Ann Selzer came out with her final poll that shockingly showed Harris in front by three points. As you can see her polls weigh very heavily into my model for Iowa and even are factored into some surrounding states, but immediately after every pollster in the country seems to have polled Iowa to see if they could replicate it which they could not, normalizing my average a bit more. That said, I don’t know if I’d ever bet money on Selzer being wrong about Iowa…
Kansas - 83.9% Trump
Finishing out the states under 90% odds, Kansas is something of an oddity and not a state I have heard mentioned much if at all this cycle, and yet my model has placed it in front of Texas in terms of likelihood to flip. There have been several strangely favorable polls showing Democrats performing well here, yet too few and not enough reputation in the polling world for me to discern if there is something going on or not. Since the Selzer poll just next door however, I have looked at it with a bit less skepticism. I don’t modify my model based off my biases, and this is what the math says. It also makes for a funny psephology paper town because I don’t know who would willingly claim Kansas is a plausible flip but me.
Others
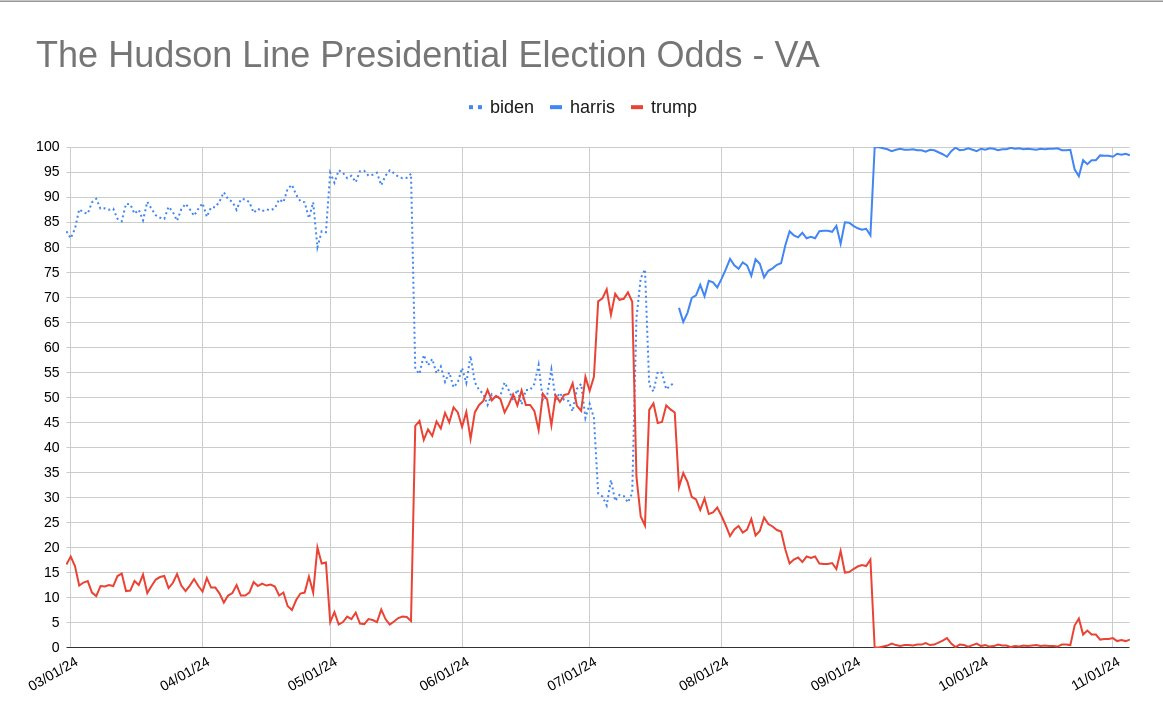
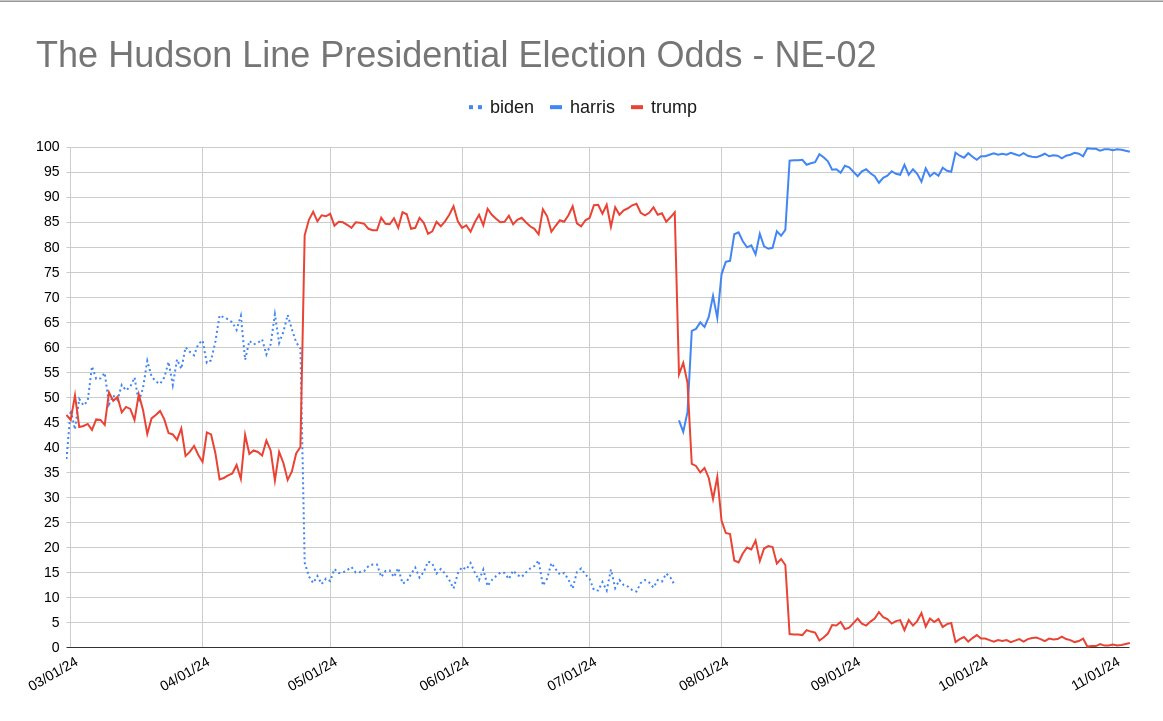
It is a busy day in the world, and so I’m posting these states charts that were competitive at various points of the year but are no longer that some may find interesting from my model without commentary. Just after them though, I have an addendum with my final NY Congressional race ratings if you are interested!
New York Congressional Lightning Round
This is still a newsletter fundamentally about New York politics, so I figure I may as well get on record with my final opinions of the NYS Congressional races.
NY-01:
I have long ago thrown in the towel trying to understand Long Island. No one I know lives there, so I’ve actually never been east of the Queens-Nassau border, and the more I hear, the less interest I have. Incumbent Republican Nick LaLota faces challenging former CNN reporter John Avlon in Suffolk County. Leading in the polls and with partisan trends on his side, I expect LaLota to dispatch Avlon with ease. Safe LaLota.
NY-03:
Incumbent Democrat Tom Suozzi faces former Republican Assemblyman Mike LiPetri in northern Nassau County. I see the results of 2022 as a traumatic fluke for this district and expect Suozzi to win with even more ease than LaLota. Safe Suozzi.
NY-04:
In southern Nassau County, we have a rematch between now Republican Congressman Anthony D’Esposito and 2022 opponent Laura Gillen. With D’Esposito plagued by scandal in relatively blue turf against Gillen’s boring but steady campaign, I expect he’s in trouble. Likely Gillen.
NY-17:
Former Democratic Congressman Mondaire Jones has alienated his constituents by carpetbagging to Brooklyn, his progressive allies by endorsing George Latimer, and otherwise seemed to have done all in his power to render himself as unlikeable as possible. Republican incumbent Mike Lawler meanwhile has run a pretty effective constituent services system and built a lot of connections with the Orthodox Jewish communities in Rockland County which largely backed his opponent last cycle, even seeing the Rockland buchurim of course coincidentally back a Republican operative in the Working Families Party primary over Jones. Lawler has proven himself an effective operator in unfavorable terrain. Lean to Likely Lawler.
NY-18:
Despite winning this district as lieutenant governor to Lee Zeldin’s gubernatorial run, Alison Esposito has failed to coalese an operation which can generate much of anything besides campaign finance scandals. The rebbes of Kiryas Joel have also both backed her opponent, even though they split between Ryan and his opponent in 2022. He has assembled a coalition that spans from the ultraorthodox Jewish community to AOC. In my Molinaro piece, I doubted Pat Ryan was above a replacement level Democrat. I may be proven wrong this cycle. Safe Ryan.
NY-19:
My previous article and my most successful one to date was a long-winded profile piece on incumbent Republican Marc Molinaro, so as you can imagine I have thoughts. My thoughts have evolved since September though, while I have been and remain a doubter of challenger Josh Riley’s skill as a politician and I am skeptical of his personal motive for running, Molinaro has really dropped the ball. He lags in the polls (though he did last cycle too) and continues to get in strange Twitter squabbles about whether pets are actually being eaten by the legal migrant community in Springfield, OH and other fringe issues. I’ve heard from a lot of people who were with him in 2022 that are turned off by it. So I recant my position in my article. Tilt Riley.
NY-22:
After being carried to victory by less than a percentage point in the Zeldin wave of 2022, Brandon Williams faces down popular State Senator John Mannion and a former schoolteacher of the NYSUT, which has not been frugal with their mailers across the district. Williams has responded by being in frame as a Congressman from Upstate New York while Mike Johnson said into a camera he’d like to overturn the CHIPS Act and also… submitting petitions to be the Republican, Conservative, and… Libertarian nominee for Congress? Likely Mannion.
I hope you all have as enjoyable an Election Night as you reasonably can. I’ll be back when the dust settles.


